A safety table can put several percentages next to one another while measuring quite different things. Before comparing their size, ask what has been counted: people, episodes, intensity classifications or decisions about continued treatment. Those choices determine the question a number answers. A shorter bar does not, by itself, explain an individual experience or identify the best service for obtaining care.
This reading guide uses a focused STEP safety figure as a starting point for original methodological explanation. The figure preserves the clinical context; the worked examples use fictional equipment, shipments and laboratories. Keeping those examples separate makes the arithmetic inspectable without turning it into a new medical estimate. The aim is a repeatable way to read research and recognize the additional evidence required by a stronger claim.
Reading the evidence
- Counted object
- A count of people and a count of episodes answer different questions.
Sources: Wharton 2022
- Eligible set
- A denominator is an inclusion rule as well as a number.
Sources: Wharton 2022
- Weighting rule
- An adjusted summary requires its stated weighting method for interpretation.
Sources: Wharton 2022
- Linked records
- Separate category totals do not reveal which individuals belong to both.
Sources: Wharton 2022
- Evidence identity
- Match a research question, product document and service claim separately.
Sources: Wharton 2022; Wegovy label
Two different safety outcomes
Intensity and a decision to stop answer different questions.
The margins cannot identify which people appear in both categories.
Sources: Wharton 2022
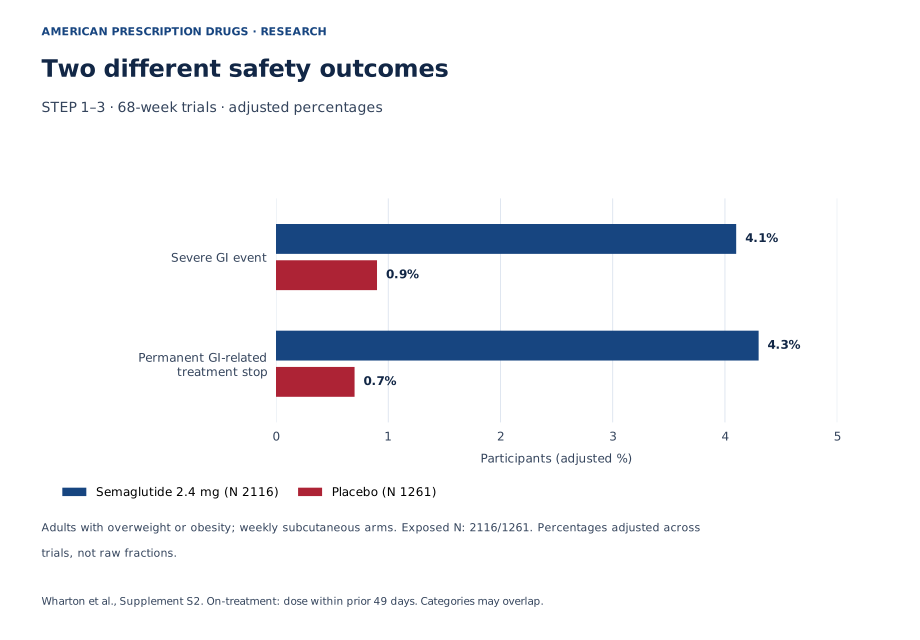
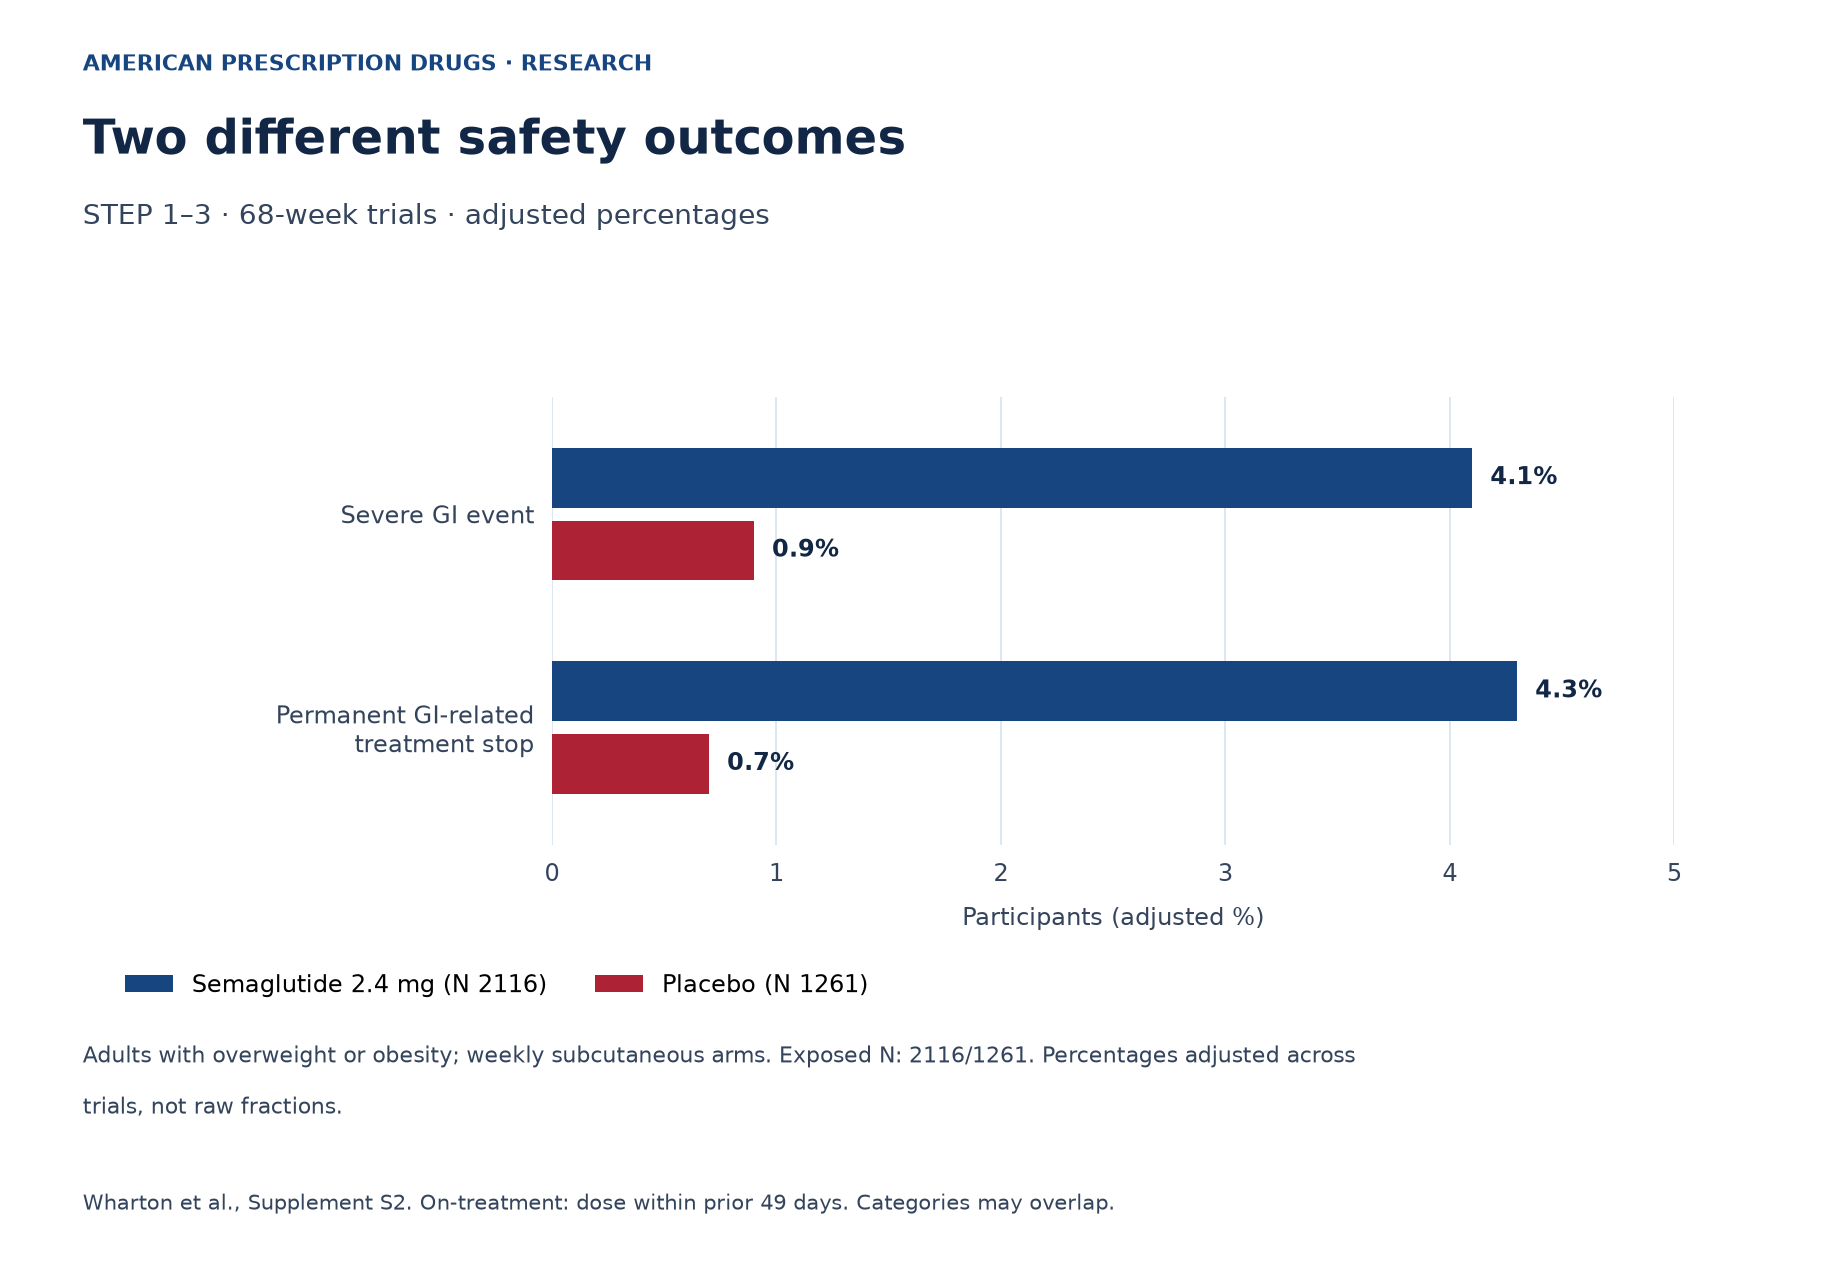
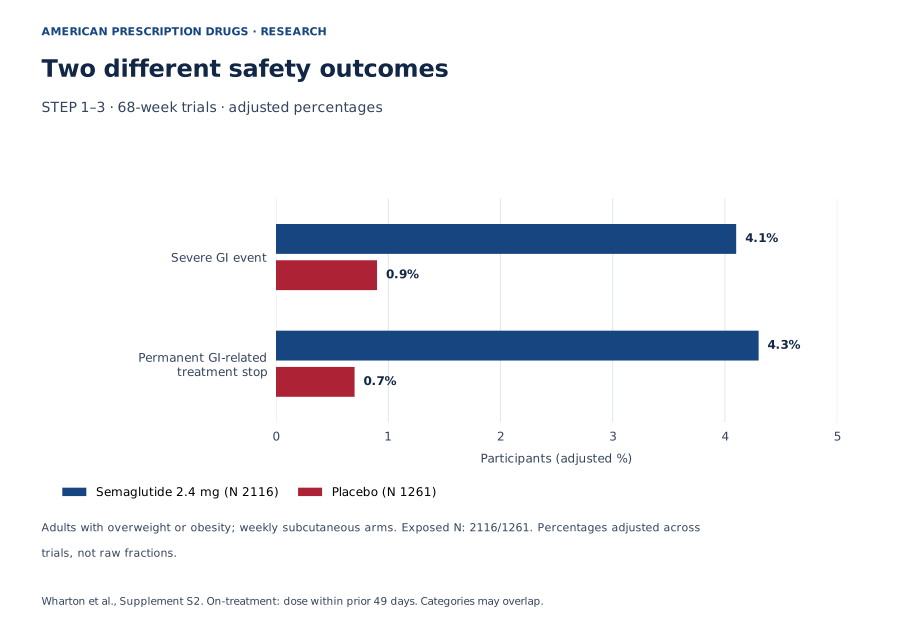
Adults with overweight or obesity; weekly subcutaneous arms. Exposed N: 2116/1261. Percentages adjusted across trials, not raw fractions.
| Outcome | Semaglutide adjusted % | Placebo adjusted % |
|---|---|---|
| Severe GI event | 4.1 | 0.9 |
| Permanent GI-related treatment stop | 4.3 | 0.7 |
Start with a small data dictionary
Wharton’s post hoc analysis pooled randomized trials. Severity described intensity; permanent discontinuation described a treatment decision. Novo Nordisk funded the trials and editorial assistance; three authors were employees and shareholders. On-treatment reporting included dosing within the preceding 49 days.
For interpretation, make a short dictionary before reading across the figure. Give each outcome its own entry, including the counted object, the qualifying condition and the observation window. Keep intensity, administrative decisions and observation status in separate fields. That arrangement prevents a familiar word such as safety from becoming an unstated composite score. It also makes a missing definition visible before any calculation begins.
This is an editorial reading method, not a new analysis of participant records. A useful dictionary can include a column for the question the measure leaves unanswered. A classification may describe an experience without explaining its cause; a decision may involve considerations that the classification never records. The semaglutide and Ozempic identity guide provides a separate place to organize naming questions. Resolving a name does not resolve an outcome definition, and both should be explicit before comparing documents.
Sources: Wharton 2022
Count people and episodes on separate lines
Consider an invented, nonclinical equipment audit. Twelve machines produce alarms, and those machines generate twenty-nine alarm episodes. The first count tells us how many machines were affected. The second describes the volume of recorded activity. Neither is a percentage until an appropriate denominator is supplied, and dividing the episodes by the machines does not produce the share of machines that experienced an alarm.
The same total episode count could arise from one machine producing many alarms or from alarms spread more evenly. A single average would conceal that distribution. To investigate concentration, the auditor would need a machine identifier attached to every episode. To investigate burden, the auditor might also need duration or interruption records. Those are additional variables, not information that can be recovered by renaming the original count.
Apply this logic as a reading habit: write the unit beside every number before interpreting the surrounding adjective. If a passage moves from an event count to a statement about people, check the bridge between them. A clear explanation should tell the reader when it changes units. This hypothetical exercise supplies no estimate of clinical frequency or individual burden.
Sources: Wharton 2022
Treat the denominator as an eligibility decision
In another fictional, nonclinical example, a shipment contains ninety items. Eighty-six are tested, and six fail the test. The observed failure share among tested items is six divided by eighty-six, approximately 6.98%. Dividing the same six by all ninety shipped items gives approximately 6.67%, but that calculation describes known failures per shipped item. It does not establish the overall failure share when the four untested outcomes remain unknown.
The discrepancy is not a rounding problem. The questions have different eligible sets. A reader deciding which fraction to use must first decide whether the target is observed test performance or the condition of the whole shipment. Calling the larger denominator more complete does not fill in the missing observations. Conversely, using only tested items does not automatically make their experience representative of everything shipped.
A denominator audit therefore asks who could enter the numerator, when eligibility began and whether every eligible unit had the same opportunity to be observed. This original worksheet separates several common questions. Its rows are methodological prompts, not alternative ways to recalculate the clinical figure.
| Measure being considered | Required denominator or record | Question still unanswered |
|---|---|---|
| Share of people with a qualifying event | People eligible for that event definition and observation window | How often did each affected person experience it? |
| Frequency of recorded episodes | Relevant exposure time or another explicitly defined opportunity measure | How many distinct people were affected? |
| Share making a recorded stopping decision | People eligible for the specified decision outcome | What combination of reasons led to that decision? |
Sources: Wharton 2022
Read adjusted percentages as a defined calculation
Imagine two fictional laboratories performing equipment checks. Laboratory A completes eighty tests and flags eight; laboratory B completes twenty and flags six. Their separate flag shares are 10% and 30%. Pooling every test equally gives fourteen flags in one hundred tests, or 14%. Giving each laboratory equal weight instead gives the average of 10% and 30%, which is 20%. Both calculations are arithmetically coherent, but their weighting rules differ.
This invented example does not reproduce the adjustment used in the clinical analysis. It shows why a summary can depend on more than a combined numerator and denominator. The first calculation emphasizes the larger laboratory through its greater number of tests. The second represents an equally weighted pair of laboratories. Neither result becomes meaningful merely because it has been labeled adjusted or unadjusted.
When reading a reported adjusted percentage, identify the method before attempting to reconstruct it. A raw fraction may answer a related question without reproducing the published summary. The guide to evaluating GLP-1 marketing claims offers a place to organize documentary questions; the specific arithmetic still requires the methods behind the statistic under discussion.
Sources: Wharton 2022
Ask which population the weights represent
Weighting changes the composition represented by a summary. In the fictional laboratory exercise, a reader concerned with the experience of an average test might prefer one target, while a reader giving each laboratory equal importance might prefer another. The choice should follow the research question. Selecting whichever weighting produces a more appealing number would reverse that order and conceal a substantive decision inside arithmetic.
To reproduce an adjusted calculation, one generally needs the relevant group-specific inputs, the precise weighting procedure and the handling of incomplete observations. A method name alone does not supply every input. A useful audit separates knowing what calculation was intended from having enough information to repeat it. Those are different levels of reproducibility, and neither should be implied by a visually convincing chart.
Adjustment also has limits as a logical operation. Reweighting observed groups does not reveal an unobserved outcome or create a randomized assignment that never occurred. A sensitivity exercise can ask how conclusions change under stated alternative weights, but the alternatives need a reason and must remain visibly hypothetical. Here, the laboratory arithmetic teaches that question without generating alternative clinical estimates.
Sources: Wharton 2022
Separate category totals from overlap
Consider a fictional audit of twenty devices. Five have severe faults, and four are withdrawn from service. If two devices belong to both categories, seven belong to at least one: five plus four minus two. If four belong to both, the total in at least one category is five. The category totals stay identical while the overlap changes. These invented examples describe devices, not people or treatment outcomes.
This is the distinction between marginal information and joint information. A marginal total describes one category on its own. Joint information identifies combinations for the same unit. Adding separate percentages as though the groups were disjoint silently assumes there is no overlap. Dividing one total by the other as a conditional probability silently assumes a particular relationship between the groups. Neither assumption follows from the margins.
To answer a conditional question, request a cross-tabulation or linked records with compatible definitions and timing. The companion guide to SURMOUNT symptom subgroups develops another way that grouping changes the question. Read each figure on its own terms; proximity in an education library does not create a common comparison population.
Sources: Wharton 2022
Add chronology before explaining a decision
Even linked categories do not automatically establish a sequence. In the device example, a fault could be recorded before withdrawal, after a withdrawal decision or during an inspection triggered by that decision. A list containing both labels would not distinguish these possibilities. Dates, recording rules and reasons are needed before the auditor can describe an order of events, let alone explain why one followed another.
A conditional percentage and a time-to-event question also require different information. The former needs a clearly defined group and outcome; the latter needs a starting point, follow-up and rules for incomplete observation. A record that ends before an event is observed cannot simply be treated as though the event will never occur. Likewise, the absence of a recorded reason is different from a recorded statement that no reason existed.
Use the worksheet below to make a proposed explanation testable. Each row names the additional record that would help. Asking for that record is more informative than repeating that evidence is limited, because it identifies exactly which uncertainty prevents the conclusion. It does not imply that the missing record would necessarily support the proposed explanation.
| Proposed question | Additional evidence required | Remaining interpretation issue |
|---|---|---|
| What share stopped after a severe event? | Linked classifications and decisions with a defined eligible set | Association alone does not identify the reason for stopping. |
| How long until a stopping decision? | Start dates, decision dates and incomplete-follow-up rules | The chosen start changes the time being measured. |
| Did episodes recur before the decision? | A chronological episode record for each individual | Recording intensity may affect what appears in the record. |
| Which reason drove the decision? | Documented reasons and how multiple reasons were handled | A recorded reason need not capture every contributing consideration. |
Sources: Wharton 2022
Keep uncertainty attached to the question
A numerical summary can be precise in its presentation while the intended inference remains uncertain. Decimal places describe formatting; they do not establish a narrow interval of plausible population values. Similarly, a difference visible between bars is a descriptive comparison until the relevant uncertainty and design have been considered. This distinction helps prevent the visual distance on a page from becoming an unsupported probability statement.
Different uncertainties need different responses. Sampling uncertainty concerns what might vary across comparable samples under stated assumptions. Missing information about overlap requires linked categories. Uncertainty about definitions requires clearer measurement rules. Uncertainty about transfer to a different product or setting requires evidence of that match. One confidence interval, even when available, would not automatically resolve all of those questions.
The brand-name and compounded GLP-1 guide can serve as a documentary checkpoint when a reader encounters different product descriptions. Our editorial inference is limited: similarities in terminology are a reason to investigate identity, not a substitute for evidence connecting the products. Preserve the distinction between an unresolved match and a demonstrated difference; either conclusion requires its own support.
Sources: Wharton 2022
Match a research document to a service claim
A research paper, a product label and a service agreement have different jobs. The first describes a bounded investigation. The second concerns a named product. The third sets out a relationship with a seller or care service. Our editorial approach is to place these documents side by side and mark which question each actually addresses, rather than letting a research citation stand in for every other document.
For example, someone reviewing a service could use the Ro review as a starting point for questions about the documents and terms that need checking. The Mochi Health review supplies another review destination for that documentary exercise. These links do not establish current product availability, a specific clinical offering or the service’s ability to reproduce a trial outcome. Current terms need their own direct verification.
A practical comparison sheet might contain product identity, named responsible parties, dated terms and the claim being evaluated. Leave a cell unresolved when the relevant document is absent. Do not fill it with a trial percentage merely because that number is available. The reasoning is evidentiary: a document can be credible and still answer a different question from the one a prospective customer is asking.
Sources: Wharton 2022; Wegovy label
Keep the current label beside the historical analysis
The current WEGOVY label covers injections and tablets. It contraindicates use with personal or family medullary thyroid carcinoma, MEN2 or prior serious hypersensitivity; human thyroid-tumor risk is uncertain. Warnings address pancreatitis, gallbladder disease, dehydration-related kidney injury and severe gastrointestinal reactions. Use is not recommended with severe gastroparesis. Contact a clinician for severe or persistent symptoms and seek prompt assessment for severe persistent abdominal pain. Inform the procedural team before anesthesia; this analysis supplies no withholding or dosing schedule.
The role of that passage is to keep current safety information visible while the article teaches research interpretation. The numerical reading exercises are not a substitute for an individual clinical assessment. A person’s decision cannot be generated by inserting a table percentage into a fictional worksheet, because the worksheet was designed to clarify a scientific question rather than evaluate a particular person.
Return to the drug identity guide when names in separate documents appear interchangeable. As an editorial procedure, record the document date, exact product description and question each passage answers. Then identify any link that still needs evidence. This keeps the reading process practical: historical measurement, current product information and present service documentation remain distinct tasks, each with a clear source and a clear stopping point when information is missing.
Sources: Wharton 2022; Wegovy label
Questions about the evidence
Why does the counted object matter before a percentage is compared?
A percentage inherits the meaning of its numerator and denominator. Counting episodes can emphasize repeated occurrences, while counting affected individuals treats each eligible person once for that outcome. Write down the unit first. Otherwise, apparently similar percentages may be answering different questions even when they share the same label.
Sources: Wharton 2022
Is the largest available denominator always the most appropriate?
No. The denominator must match the group eligible to contribute the numerator under the chosen definition. A larger total may include units whose outcomes were not observed or that were never eligible for the event. Specify the target question, then identify the records needed to answer it without treating unknown outcomes as known.
Sources: Wharton 2022
Does adjustment mean a raw fraction is mathematically wrong?
Not necessarily. A raw fraction and an adjusted summary can follow different, explicit weighting rules. The useful question is which target each represents and whether the required inputs and method are available. Reproducing a simple division does not show that a different published calculation has been reproduced.
Sources: Wharton 2022
What is needed to determine how two categories overlap?
Records must connect the category assignments for the same units, with compatible definitions and time windows. Separate totals do not supply that connection. A cross-tabulation can describe overlap; explaining the sequence or reasons may require additional dated records. Each stronger question asks for information beyond the preceding one.
Sources: Wharton 2022
How should a trial citation be used when evaluating a provider?
Identify the precise claim the citation supports, then obtain the separate product and service documents needed for the provider question. A citation is not a general certificate for every statement nearby. Mark unresolved connections explicitly instead of treating a recognizable drug name as proof that the evidence transfers.
Sources: Wharton 2022; Wegovy label
Editorial assessment
A careful reading produces a question map before it produces a ranking. Identify the counted object, eligible set, observation window and weighting rule; then distinguish separate totals from linked records. Ask which additional information would establish overlap, sequence or an explanation. Finally, match each conclusion to the document capable of supporting it. That approach preserves useful scientific information while making the remaining questions specific. The fictional calculations here are tools for inspecting reasoning, not substitutes for clinical estimates, current prescribing information or individualized care.
Sources and access
- Gastrointestinal tolerability of once-weekly semaglutide 2.4 mg in adults with overweight or obesity, and the relationship between gastrointestinal adverse events and weight loss.
Complete primary article XML and selected supplementary DOCX safety-table material inspected. Selected cells were visually checked in a labeled derived rendering, not the publisher document layout.
Checked 2026-10-26.
- Gastrointestinal tolerability and weight reduction associated with tirzepatide in adults with obesity or overweight with and without type 2 diabetes in the SURMOUNT-1 to -4 trials.
Complete primary article XML inspected; original publisher Figure 1 visually checked. Supplementary DOCX retained but not used for this analysis.
Checked 2026-10-26.
- DailyMed: WEGOVY semaglutide current prescribing information
Current official prescribing information inspected.
Checked 2026-10-26.
- DailyMed: ZEPBOUND tirzepatide current prescribing information
Current official prescribing information inspected.
Checked 2026-10-26.