A chart can make a complicated research question look like a simple comparison of bar lengths. Reading it carefully starts one step earlier: how did each person become a member of the group represented by that bar? Assignment to treatment, a later report, and a measured outcome are separate pieces of information. The order matters because a comparison created after treatment begins may answer a different question from the original experiment.
This analysis develops a reading method for symptom subgroup results. Begin with the source description and accompanying figure, then work through classification, modeled averages, uncertainty, and missing observations. The teaching examples below use invented workplaces, project scores, and courses; they are nonclinical illustrations, not additional trial data. The aim is to make each inference traceable, including the point where a numerical description ends and a new research question begins.
Reading the evidence
- Start with membership
- Write down the rule that places an observation in a group before interpreting its average.
Sources: Rubino 2025
- Name the summary
- An average, a proportion, and an individual prediction answer different questions.
Sources: Rubino 2025
- Keep units visible
- A difference between percentages is expressed in percentage points.
Sources: Rubino 2025
- Locate uncertainty
- A point estimate needs information about precision and the assumptions supporting it.
Sources: Rubino 2025
- Match the evidence
- Use separate records to assess a research claim, a named product, and a service agreement.
Sources: Rubino 2025; Zepbound label
Weight change by symptom report
Grouping people by a later report changes the question being answered.
A difference between subgroup averages does not estimate an effect of creating symptoms.
Sources: Rubino 2025
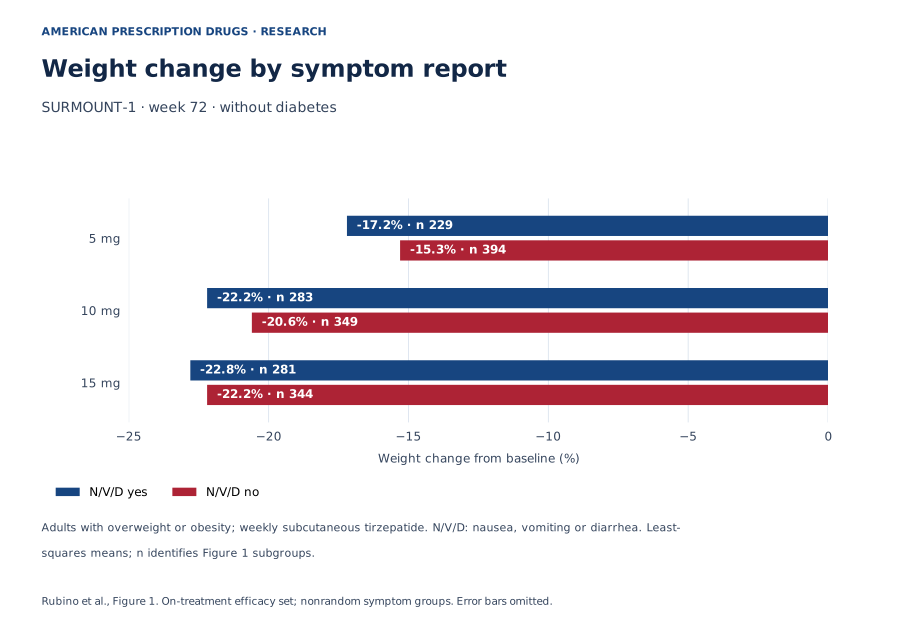
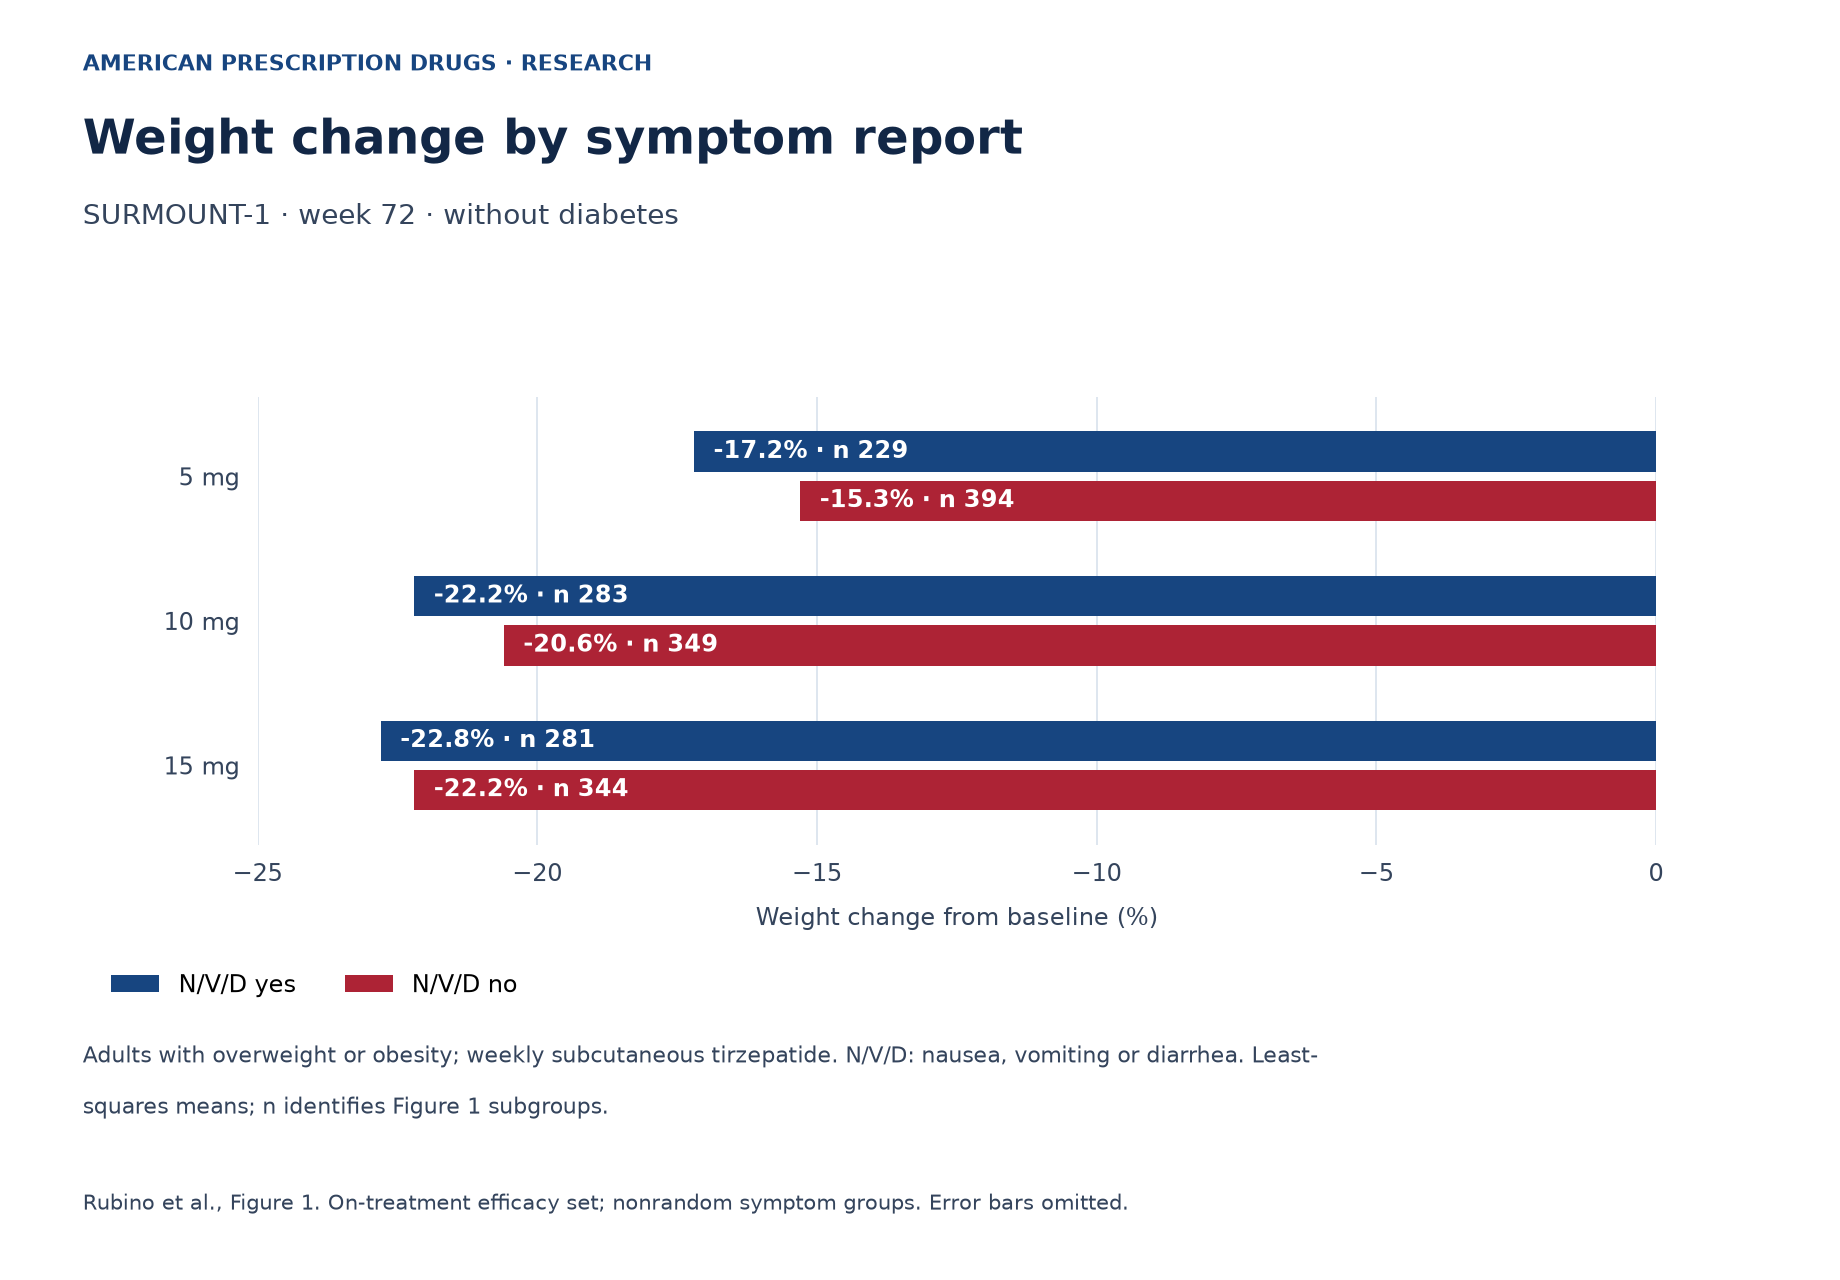
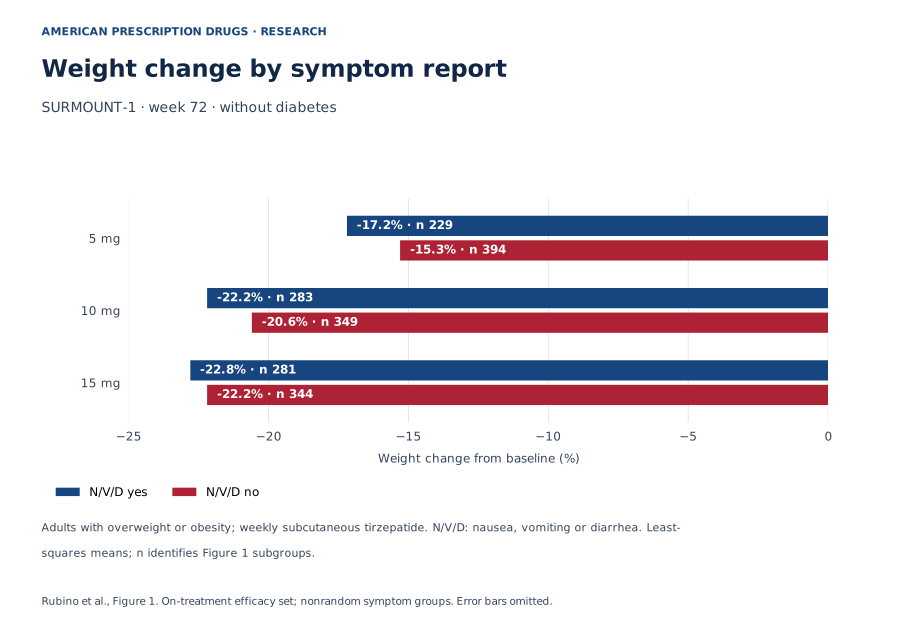
Adults with overweight or obesity; weekly subcutaneous tirzepatide. N/V/D: nausea, vomiting or diarrhea. Least-squares means; n identifies Figure 1 subgroups.
| Tirzepatide dose | N/V/D yes: mean % (n) | N/V/D no: mean % (n) |
|---|---|---|
| 5 mg | −17.2 (229) | −15.3 (394) |
| 10 mg | −22.2 (283) | −20.6 (349) |
| 15 mg | −22.8 (281) | −22.2 (344) |
Separate the source description from the inference
Rubino’s post hoc analysis grouped participants by self-reported symptoms; one event sufficed. Weight data after treatment discontinuation were excluded. Gastrointestinal events sometimes prompted stopping treatment. Eli Lilly funded the analysis; six authors were employees and shareholders. Symptom-group membership was not randomized. Clinically significant gastric-emptying abnormalities and pancreatitis history were excluded.
Treat that description as a map of the analysis rather than a conclusion about an individual. A useful reading sheet has separate spaces for the exposure being compared, the rule defining a subgroup, the outcome being summarized, and the observations allowed into the calculation. Filling those spaces prevents an attractive result from silently changing meaning halfway through an explanation. It also makes the authors’ relationships visible alongside the methods.
For interpretation, ask what a proposed conclusion would require. Describing a conditional average requires a defined group and a summary rule. Claiming that changing the grouping characteristic would change the outcome requires a causal design or defensible causal assumptions. Those are different evidentiary tasks. Neither a detailed chart nor a confident headline supplies the missing design. The practical goal is to preserve the question the evidence actually addresses while identifying the next question that remains open.
Sources: Rubino 2025
Follow assignment before following selection
Consider an invented, nonclinical workplace experiment. Employees are randomly assigned either a training workshop or the usual orientation. Afterward, the analyst separates workshop attendees into people who requested extra help and people who did not. The original assignment answers a question about offering the workshop. The later division answers a question about people classified by their behavior during it. Random assignment to the workshop does not randomly assign requests for help.
Imagine several possible explanations for a difference between those later groups. Employees with less prior experience might request help more often. Highly engaged employees might do the same. Reporting habits or access to a supervisor might also matter. These are invented possibilities, not explanations established for any medical study. They show why selecting people by a later characteristic can mix the characteristic with other influences on the outcome.
A useful causal question specifies a change that could be made, a comparison condition, and a defined outcome. Then it asks how those conditions would be made comparable. Simply relabeling selected groups as if they were assigned groups skips that work. Keep the original experiment and the later classification on separate lines of the reading sheet.
Sources: Rubino 2025
Give each variable a distinct job
Research variables are easier to understand when each has one job. An assignment variable records the intervention allocated. A classification variable records the rule used to divide observations. An outcome variable records what is measured afterward. One variable can be related to another without becoming its substitute. The table below is an original worksheet for keeping these roles separate; it adds no clinical estimates.
For every proposed comparison, write the question as a complete sentence. “What happened among people classified this way?” describes a conditional summary. “What would happen if we changed this characteristic?” asks about an intervention. The second sentence needs information the first sentence may never have collected. This distinction helps a reader spot a change in meaning even when the same group names appear in both sentences.
Identity belongs on the worksheet too. A broad medicine category, a named ingredient, and a product name should not be treated as interchangeable labels. Our guide to semaglutide and Ozempic terminology is a contextual starting point for checking names. The original study record remains the place to establish exactly what a particular research comparison concerns.
| Variable role | Question it helps answer | Additional evidence for a causal claim |
|---|---|---|
| Assigned intervention | What comparison was designed? | Allocation process and analysis rules |
| Later classification | Which observations are grouped together? | Comparable groups and defensible selection assumptions |
| Measured endpoint | What result is summarized? | Defined measurement, timing, and relevant comparator |
Sources: Rubino 2025
Examine the rule behind a group label
In another invented, nonclinical exercise, two project teams have the same number of workers who experience a technical problem. One team logs every occurrence. The other logs a problem only after it happens repeatedly. A comparison of their reporting totals could therefore reflect different logging rules even if the underlying experience were similar. A group label has meaning only when its measurement rule is known.
Several separate dimensions can be recorded: whether anything occurred, how often it occurred, how long it lasted, and how disruptive it was. A binary label compresses information into a yes or no. That can be useful for a defined analysis, but the compression does not preserve every dimension. A reader who wants to understand duration cannot recover it merely by counting positive labels.
Timing matters as well. Classification over a brief observation window and classification over a longer window need not identify the same people. Before comparing summaries, ask whether the rules and opportunities for reporting are aligned. If those details are unavailable, record the uncertainty explicitly. Do not fill the gap with an assumption that an everyday word has the same operational meaning in every dataset.
Sources: Rubino 2025
Read an average as a summary, not a person
A modeled average is an estimate generated under specified model terms. It can be designed to account for features of the data rather than simply add observations and divide by their number. Understanding it requires the model’s purpose and assumptions. The resulting value summarizes a group under that analysis; it is not a promise about the next person or a substitute for the distribution of individual results.
An invented, nonclinical example illustrates the missing distribution. Project A has scores of 2, 4, and 6. Project B has scores of 0, 4, and 8. Both average 4, yet their spread differs. Neither average tells us how many scores exceed a threshold unless we also have the underlying observations or a suitable distributional model. These numbers explain arithmetic only; they do not estimate variability in a clinical trial.
The summary’s label should travel with its value. A mean is different from a median, and neither is automatically a success rate. Similar discipline applies to other outcome categories: the companion guide to reading STEP safety outcomes develops a separate measurement question. Keep each summary connected to the definition that gives it meaning.
Sources: Rubino 2025
Distinguish group size from precision
The original figure shows standard errors without numeric values; our chart omits them.
In general statistical reasoning, a group size tells us how many observations or people belong to a defined set. Precision also depends on variation, the structure of the observations, and the model used to estimate the average. A larger count does not disclose all of those features. Repeated measurements from one person, for example, are not automatically equivalent to the same number of independent people.
A standard deviation describes dispersion in observations. A standard error describes uncertainty in an estimator under the analysis assumptions. A confidence interval uses an inferential procedure to express a range associated with that uncertainty. These concepts have related mathematics, but their labels are not interchangeable. Treating one as another can make a graphic appear more informative than its supporting record.
The appropriate reading response to missing precision information is to keep the point estimate descriptive and identify what would be needed for stronger inference. That could include the relevant covariance structure, model specification, and a defined contrast. Bar spacing alone cannot supply those inputs. Nor does a visually small separation establish that two groups are equivalent for a decision someone wants to make.
Sources: Rubino 2025
Keep subtraction separate from explanation
Consider invented, nonclinical project metrics expressed as changes from baseline. One project’s average change is −12%; another’s is −9%. Subtracting the second from the first gives −3 percentage points. This arithmetic compares two percentage changes. It does not establish why the projects differed, and it does not by itself define a relative change between the two reported percentages.
The order of subtraction determines the sign. Reversing the comparison gives +3 percentage points. A careful explanation therefore names the reference group and preserves the unit. It also states the baseline convention: percentages calculated from different starting quantities can be numerically comparable while representing different absolute amounts. Clear arithmetic begins with a defined question, not with whichever subtraction produces the most striking number.
Explanation requires another step. An observed difference might motivate a hypothesis, but testing that hypothesis needs a design that can address competing explanations. Our guide to evaluating GLP-1 marketing language provides a place to examine how claims are phrased. For this reading method, the essential check is whether a statement moves from “these summaries differ” to “this characteristic caused the difference” without adding evidence.
Sources: Rubino 2025
Ask which observations remain in the analysis
Imagine an invented, nonclinical course evaluation. Some students stop attending before the final assessment, but the school could still try to measure their later performance. An analysis of scores collected while students attend answers one question. An analysis following the original enrollment regardless of attendance answers another. Neither question can be understood from a final average without knowing whose observations were eligible.
Missing observations introduce assumptions. If students with unrecorded results would have differed systematically from those observed, the available records may not represent the whole intended population. A model can describe a way to estimate missing information, but the model does not reveal the unobserved values directly. Sensitivity analysis explores how conclusions depend on alternative assumptions; it does not convert those assumptions into observed facts.
This is also an identity problem: specify the set of people, the observation window, and the treatment or product being discussed. The brand-name and compounded GLP-1 guide is a contextual destination for documentary questions about product categories. A transfer of research findings would still require its own justification. Similar words on two records do not establish that their populations, formulations, or analysis conditions match.
Sources: Rubino 2025
Match the claim to the evidence it would need
A useful interpretation ends with a claim that is small enough for the evidence supporting it. The worksheet below separates four common ambitions: explaining causation, establishing practical equivalence, predicting an individual result, and assessing a service. Each needs a different evidentiary bridge. Keeping them separate is more informative than attaching a broad disclaimer after an overextended conclusion.
For equivalence, a reader needs a meaningful margin and an analysis designed to evaluate it. For prediction, performance in relevant new individuals matters. For a service decision, current documentation about the specific agreement matters. These are general standards for framing questions, not findings about any company. Our editorial interpretation is that a research graphic should not be asked to stand in for records it does not contain.
The Ro review and Mochi Health review are destinations for examining documentary terms and identifying questions to verify with each service. These links do not establish current product availability or clinical performance. Read any service agreement on its own terms, including what is included and which records substantiate a claim. The scientific comparison remains a separate item in that assessment.
| Proposed claim | Evidence needed | Appropriate reading response |
|---|---|---|
| A characteristic causes an outcome | A causal comparison with defensible assumptions | Separate association from an intervention effect |
| Groups are practically equivalent | A justified margin and relevant uncertainty analysis | Avoid inferring equivalence from appearance |
| An individual result is predictable | A validated prediction approach for relevant people | Keep group summaries separate from prognosis |
| A service reproduces a research result | Evidence about that specific service and claim | Examine service documentation independently |
Sources: Rubino 2025; Zepbound label
Use the current label for the current product question
Current ZEPBOUND labeling concerns a subcutaneous injectable product. Contraindications include personal or family medullary thyroid carcinoma, MEN2 and serious hypersensitivity; human thyroid-tumor risk remains uncertain. Warnings cover pancreatitis, gallbladder disease, dehydration-related kidney injury and severe gastrointestinal reactions. Use is not recommended with severe gastroparesis. Severe or persistent symptoms warrant clinician contact; persistent severe abdominal pain needs prompt assessment. Inform procedural clinicians before anesthesia. Symptom-group averages provide no individual dosing or withholding instructions.
The broader reading principle is to assign each document a clear purpose. A research analysis explains a bounded scientific comparison. A product label supplies current product information. A service agreement describes an arrangement with a seller or care organization. These records can inform the same conversation while answering different questions. Their conclusions should remain attached to the document and identity that support them.
Return to the worksheet before drawing a conclusion: identify the group, name the summary, locate the uncertainty, and write the exact claim being considered. Then identify any additional record needed to support that claim. This process turns an appealing chart into an auditable argument. It also leaves room for a clinician to assess the individual circumstances that a group-level statistical explanation does not contain.
Sources: Rubino 2025; Zepbound label
Questions about the evidence
Why does a later grouping need a separate interpretation?
A later classification can collect people who differ in several ways relevant to an outcome. To interpret it, specify the membership rule and ask what makes the resulting groups comparable. The fact that an earlier intervention was assigned experimentally does not answer every question about a later selection.
Sources: Rubino 2025
Does a modeled average describe a typical individual?
It describes a summary under the analysis model. Understanding individual variation requires additional information about the distribution and, for prediction, evidence about predictive performance. An average alone cannot show how many people cross a threshold or establish the result expected for a particular person.
Sources: Rubino 2025
What should I do when a chart lacks uncertainty values?
Identify the estimate as descriptive and look for the relevant precision information in the source record. Avoid inventing intervals from the appearance of a graphic. A stronger comparison requires a defined contrast and the information needed to estimate its uncertainty under the analysis assumptions.
Sources: Rubino 2025
Why use percentage points when subtracting percentages?
The unit preserves what the arithmetic compares. A percentage-point difference subtracts two percentages directly. A relative percentage calculation introduces a reference denominator and answers another question. Naming the reference, sign, and unit helps prevent a simple subtraction from becoming a misleading explanation.
Sources: Rubino 2025
How should I connect a research article to a provider review?
Use the article to define the scientific question and the review to identify documentary questions about the service. Verify current terms separately. A connection between pages is a reading aid; it does not supply evidence that a particular service delivers the population, product, or outcomes of a study.
Sources: Rubino 2025; Zepbound label
Editorial assessment
A sound reading of a subgroup chart preserves the chain from membership rule to observation set to statistical summary. Our interpretation is that the most useful conclusion is the one that states its question precisely and leaves unsupported extensions open. Write down the proposed claim, the evidence that directly addresses it, and the assumptions still required. This produces a more durable understanding than treating a bar height as an explanation, an individual forecast, or a judgment about a retail service.
Sources and access
- Gastrointestinal tolerability of once-weekly semaglutide 2.4 mg in adults with overweight or obesity, and the relationship between gastrointestinal adverse events and weight loss.
Complete primary article XML and selected supplementary DOCX safety-table material inspected. Selected cells were visually checked in a labeled derived rendering, not the publisher document layout.
Checked 2026-10-26.
- Gastrointestinal tolerability and weight reduction associated with tirzepatide in adults with obesity or overweight with and without type 2 diabetes in the SURMOUNT-1 to -4 trials.
Complete primary article XML inspected; original publisher Figure 1 visually checked. Supplementary DOCX retained but not used for this analysis.
Checked 2026-10-26.
- DailyMed: WEGOVY semaglutide current prescribing information
Current official prescribing information inspected.
Checked 2026-10-26.
- DailyMed: ZEPBOUND tirzepatide current prescribing information
Current official prescribing information inspected.
Checked 2026-10-26.